Microsoft has taken the wrapper of a new Azure cloud service. Called Azure Network Watcher, the solution gives customers access to numerous logging and diagnostic capabilities. The company announced the platform via a blog post, explaining the details and features of the suite.
And feature packed it is too. With the integrated tools, users can add more power to insights and understand network health and performance in more detail. Microsoft says the Azure Network Watcher works within PowerShell, CLI, Portal, Rest API and SDK.
The company created the service to help customers diagnose critical problems. In the past, this meant a time-consuming process of accessing packet data in a virtual machine. Now this can be achieved more rapidly. What's more, users can now log flow data, visualize information, and perform other tasks.
Azure Network Watcher is packed with capabilities. Among them is Packet Capture, which allows users to capture packets in virtual machines and apply advanced matching options. Topology gives customers an overview of their deployments in a simpler process. With next hop, investigations can be conducted through the IP address based on a specific VM.

Microsoft says Azure Network Watcher is available in preview now. So far, customers in US West Central, US North Central, and US West can try it out. The company adds it will roll out the service to global Azure regions in the future.
In terms of cost, Microsoft says it believes the new features are critical to network management. With that in mind, the company is releasing the suite for free to Azure subscriptions.
Azure Network Watcher Capabilities
- Topology: You can now view the network topology of your deployments with just a few clicks. For example, the figure below represents the network topology of a simple web application deployed on Azure. With Network Watcher, you can now visualize the complete network topology of your application.
- IP flow verify: A common diagnostic need is to check whether a flow is allowed or denied to or from a virtual machine. Using “IP flow verify” you can now validate if a flow (combination of source IP, destination IP, source port, destination port and protocol) is allowed or denied.
- Next hop: Typical issues with network connectivity is misconfiguration of user defined routes. Next hop provides the ability to get the next hop type and IP address based on a specified virtual machine, allowing you to investigate any route being black-holed and conditions caused by incorrect configuration.
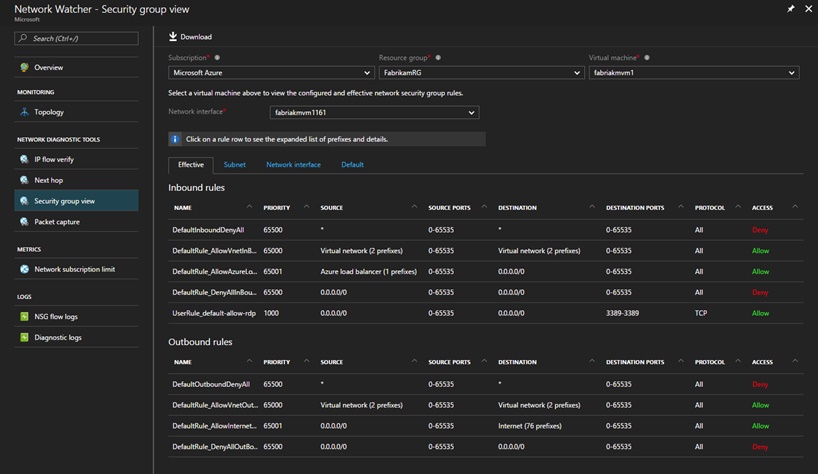
- Security Group view: Auditing your network security is vital for detecting network vulnerabilities and ensuring compliance with your IT security and regulatory governance model. With Security Group view, you can retrieve the configured Network Security Group and security rules, as well as the effective security rules.
- Packet capture: With Network Watcher, you can trigger packet capture on virtual machines. Applying advanced rule matching options, you can capture packets that have a specific source IP, destination IP, source port or destination port, or a byte offset from the start of the packet – even a combination of all the above.
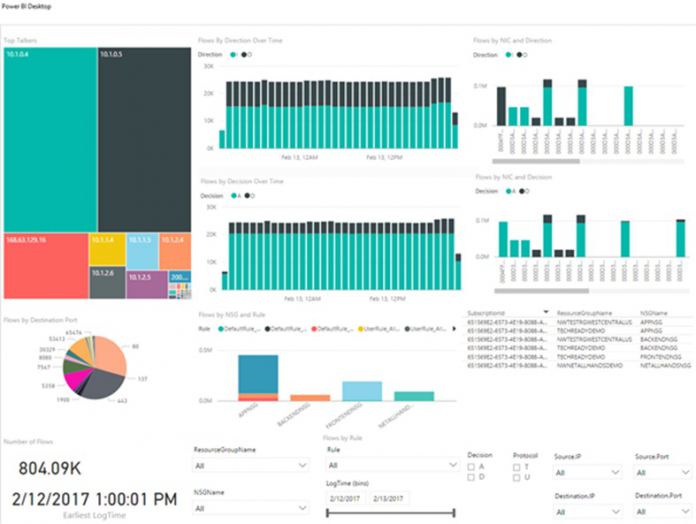
- NSG flow logs: Flow data is a critical component for diagnosing and validating your Network Security Group configurations. You can now enable logging of NSG flow data that is allowed or denied per Network Security Group setting to help meet these needs.
- Network Subscription limits: You can now view the usage of network resources against the limits in your subscription.
- Diagnostic logs: You can now configure diagnostic logs for all the network resources in a group from a single pane.


