As well as launching Power BI Embedded to general availability, this week Microsoft also unveiled three new custom visuals. The company says the visuals allows users to create Power BI solutions for browsing, understanding, analyzing large collections of text.
Strippets browser, cluster map, and facet key custom visuals are available for download through the Visuals Gallery. The visuals function on any tagged document in Power BI and Microsoft says they are ideal for putting alongside text analysis from Cortana Analytics. Key phrases, people, places, and more abstract details tagged in a visual work with the new additions.
Strippets Browser
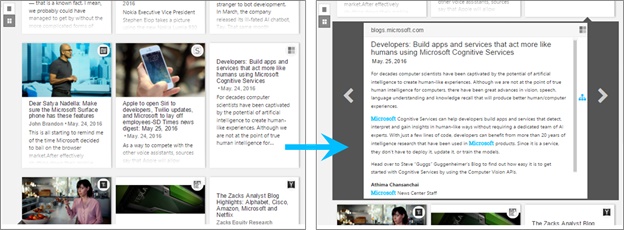
Microsoft describes the Strippets Browser Power BI custom visual as a document reader. It can perform two ways of sampling content through a collection of documents or other data.
“The first unwraps each story into a thumbnail that reveals the source, headline, and leading text and image of the story. Using the thumbnails view, the reader can scroll through a list or grid or thumbnails to quickly grasp the topic of each story in the collection. Clicking on a thumbnail activates a reading mode in which the full document contents are read in context.”
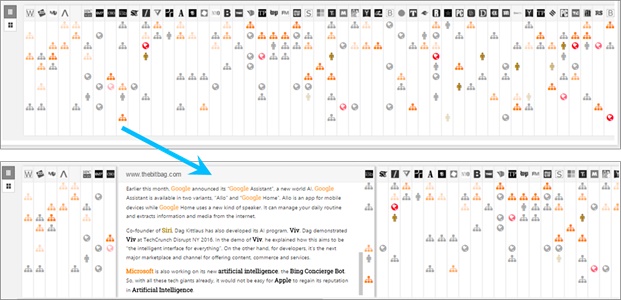
Cluster Map
while Strippets will work to grasp the general topic of a document, other times users need something more focused. A spiral layout or relational layout can be chosen in the Cluster Map, both with tools to focus on a single topic or collection.
Facet Key
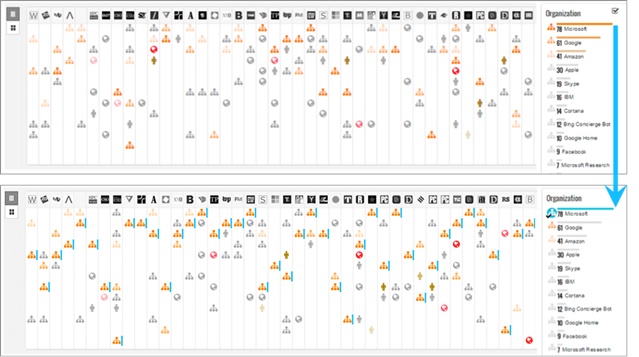
Microsoft calls the Facet Key the “final piece” for creating an analysis report for a document. The Face Key shows interest filters and highlights linked visuals. Users can:
“Enable document collections to be analyzed systematically, one entity at a time. When using a Key Facet in the same report as a Cluster Map, entity selections trigger blue highlight arcs around clusters representing the proportion of clustered documents containing references to that entity. Clusters containing no references are faded out for contrast.”
Microsoft announced the new custom visuals in a blog post. You can read all about them in more details at the source. In the meantime, you should check out the gallery below where you can see the visuals in action.


