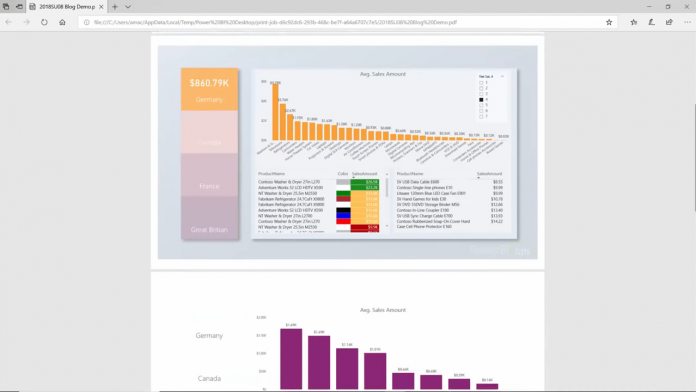
Microsoft has revealed its August release for Power BI Desktop, bringing a multitude of new features for reporting, analytics, modeling, visuals, and more. One of the most significant upgrades is the Export to PDF feature, which was implemented due to strong user feedback.
“We’ve heard loud and clear from you that we needed an option in Power BI Desktop to easily print or email copies of your reports out to others in your company,” said Power BI program manager Amanda Cofsky. “We’ve been working on a solution to this problem for a while now and are glad to share that with this month’s update you can now export all visible report pages to PDF. You’ll find this new option under the File menu.”
During the exporting process, users will see a ‘generating a PDF’ dialog, behind which each page will load in order. Once the PDF has exported, users will be able to interact with their report once more or open the file in their default viewer. The only limitation is an inability to print wallpaper color or images, and that may change in the future.
Power BI Desktop August 2018 Changelog
The next big feature is the addition of Python integration in preview. Data scientists can now use the programming language for analysis, data cleansing, and visualization. They can run scripts directly from Power BI via the ‘Get Data’ dialog to create their model.
On top of this, the Spark Connector is now generally available. It can also be found under Get Data, and lets users create DirectQuery reports against data in Spark clusters. It’s followed by a number of smaller features across modeling, analytics, and visualization:
- “Reporting:
- Create bookmark groups
- Theming generally available
- Slicer restatement
- Analytics:
- Conditional formatting by values
- Q&A improvements
- Q&A in Power BI Desktop generally available
- Better matching experience for Power BI Desktop and Power BI Premium
- Modeling:
- Data categories for measures
- Statistical DAX functions
- Custom visuals:
- 3AG Systems – Column Chart with Variance
- Scatter Chart by Akvelon
- Small Multiples Line Chart
- Add Natural Language Summaries for BI
- Pivot Slicer”
You can find full feature explanations and upcoming additions on the PowerBI blog.


