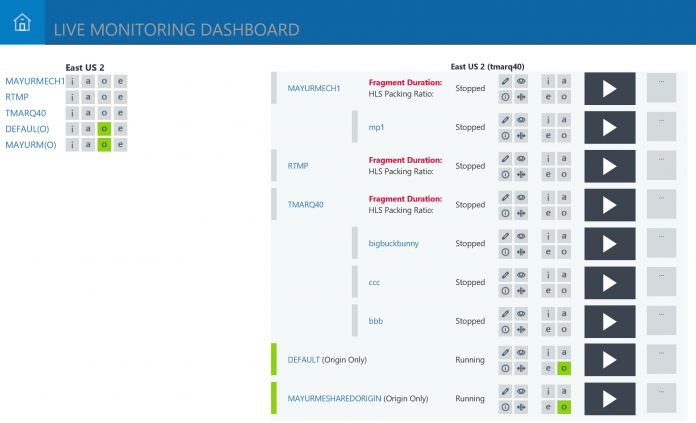
Microsoft is open-sourcing its Azure Media Services (AMS) Live Monitoring Dashboard on GitHub. This move brings the service to all users and allows developers to use the app. The Live Monitoring Dashboard is a web app based on .NET C#. It gives Azure Media Services users the ability to manage their service in a simple way.
With the Live Monitoring Dashboard, customers can see the health of their channel and find deployment origins. Using the dashboard, users can monitor ingest, archive, encode, and origin telemetry. This allows AMS customers to users to manage the health of service with information on video stream ingestion, dropped date, and origin HTTP statuses and latencies.
A pane on the left of the Live Monitoring Dashboard shows each deployment and its health status. The status is denoted by a code color. Ingest, archive, origin, and encode telemetries are given i, a, o, and e abbreviations respectively.
The color codes show the health of the deployment. For example, green means healthy, orange means mildly impacted, while red indicates unhealthy. If the deployment is grey, it is currently inactive. While automatic thresholds are in place for when the color states happen, users can customize them from the storage account JSON configuration file.
Detailed View
Customers can also see more detailed information about deployments by clicking an active status.
Live Monitoring Dashboard is backed by an SQL database that uses telemetry data from Azure storage. This means all views are updated with the latest data every 30 seconds. There are several advantages to the detailed view, as Microsoft explains:
“The channel detailed view provides incoming bitrate, discontinuity count, overlap count, and bitrate ratio data for a given channel. In this view, these fields represent the following:
- Bitrate: the expected bitrate for a given track and incoming bitrate is the bitrate that the channel receives
- Discontinuity count: the count of instances where a fragment was missing in the stream
- Overlap count: the count of instances where the channel receives fragments with the same or overlapping stream timestamp
- Bitrate ratio: the ratio of incoming bitrate to expected bitrate”


