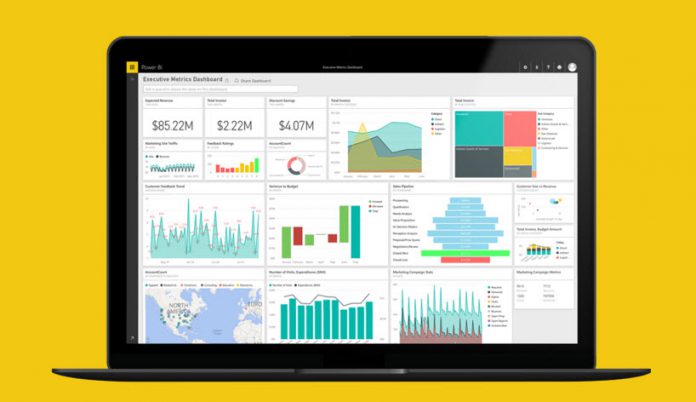
According to the Microsoft Power BI Blog, the changes should make the program more powerful, more compatible with different data sources, and should make some features easier to use.
Report View
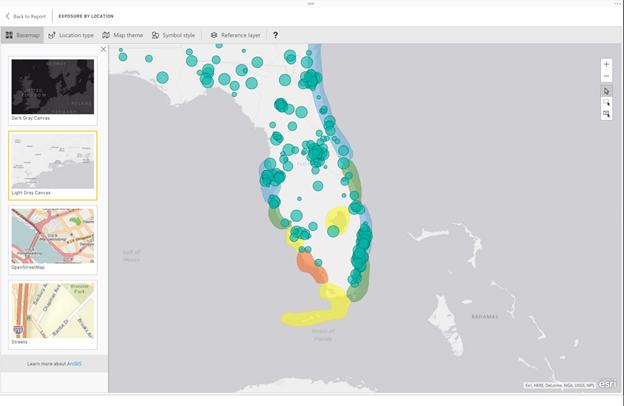
Microsoft is currently testing ESRI ArcGIs Map Integration. This enables users to create maps showing the user's data and demographics – like for a graphic showing sales at different locations with overlay for median income by group.
Or a user could create a map showing sales at different locations and could add overlays showing median income by county to visualize the relationship between demographics and sales.
Additionally, users can now create layouts for mobile reports. For example, if a company's analyst wanted to make certain charts and graphs show up on one screen in the Power BI mobile application, the analyst can click and drag to create a screen view for the company's mobile Power BI users.

Further, Microsoft has added ways to change how users can drill down data. This gives users the ability to create graphs tailored to the user's data.
Analytics
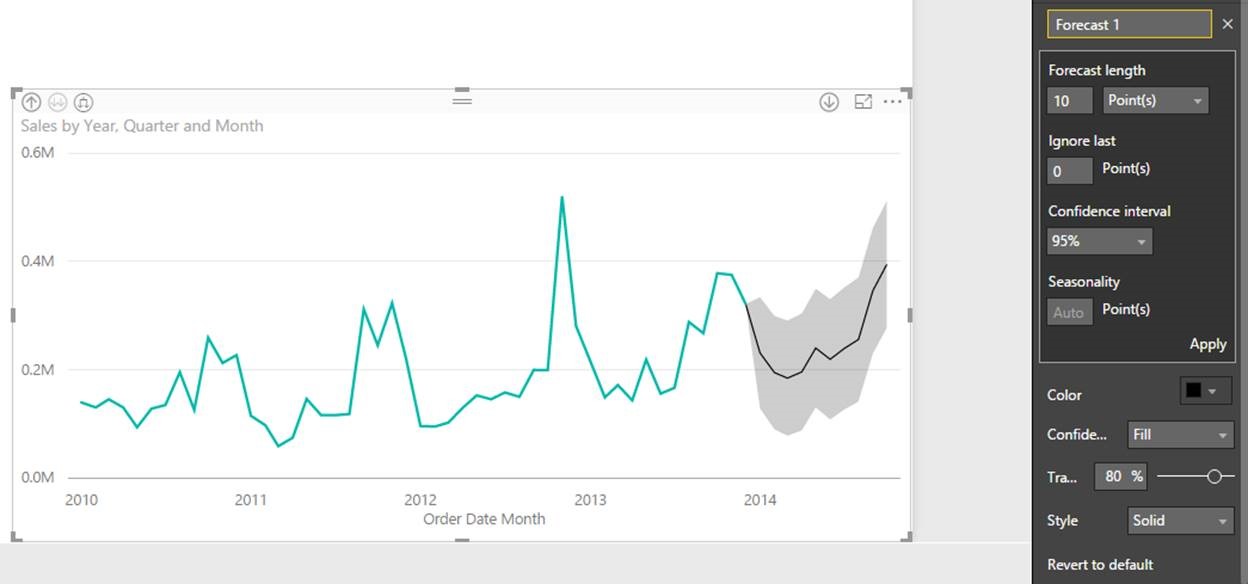
Statistical models have been added so the software can create forecasts based on a user's data set It even lets you show the confidence interval, which indicates how reliable the forecast is based on your previous data.
Power BI added the ability for users who create R visuals to use their preferred R editor software. Previously, users could only use the R editor included with the software, which has limitations.
Data Connectors and Query Editing
Microsoft has added a connector for ProjectPlace, so users can now import ProjectPlace data into the program. The connection with Snowflake has been upgraded to provide users the ability to interface with Snowflake data using DirectQuery mode. Furthermore, Microsoft improved or enhanced connectors for several other data sources.
Microsoft has also made improvements to the Query Editing functions. Highlights include the ability for users to see data sources and load status at a glance. Further, the software now has a function to highlight potential errors in the user's data. This feature should save users time and effort in trying to track down mismatched data types.


