Following user feedback, Microsoft has announced updates to the features of their Azure audit logs which will make it easier to view and analyze diagnostic data.
Azure Audit logs capture all write operations performed on resources. The logs can then be used to find errors while troubleshooting or to monitor how users are modifying resources.
The update adds some new capabilities that should fix most of the issues users were complaining about. Foremost in this is an upfront filter experience:
“We are bringing the main filter experience upfront, without having to open new blades. We heard your feedback and issues around horizontal scrolling and we have avoided opening new blades unless it is absolutely necessary.”
Other improvements include:
- Graph lookup for user/service principal information
- Quick Insights
- Queries – reuse commonly-used filters
- Pin queries to dashboard
- Unified results view
- Contextual summary information
- Download CSV files
Graph Lookup
The new filter experience means that you can search operations by a particular user directly. An exact email address is not needed. Information can be found using a behind the scenes graph lookup from Azure Active Directory.

The graph lookup also applies to service principles:
“If you have automated your scripts and deployments using service principals, you can now filter and view entries specifically performed by a specific service principal.”
Quick Insights
The addition of Quick Insights gives a list of the most recent changes to resources. Without any filters, you can see:
- Number of failed deployments
- Number of role assignments
- Number of errors
- Number of alerts fired
- Number of outage incidents
When you click on one of these, Azure fetches the query results and auto-fills the filters.
Queries
Typical filter patterns can now be re-used as queries. Example f you want to show all errors in a particular resource group – you can create a query to do that. When you need to do it again, it’s right there and can be re-used, rather than setting filters.
To make this even faster, you can pin them to the dashboard. Multiple can be viewed there without having to open the audit logs table.
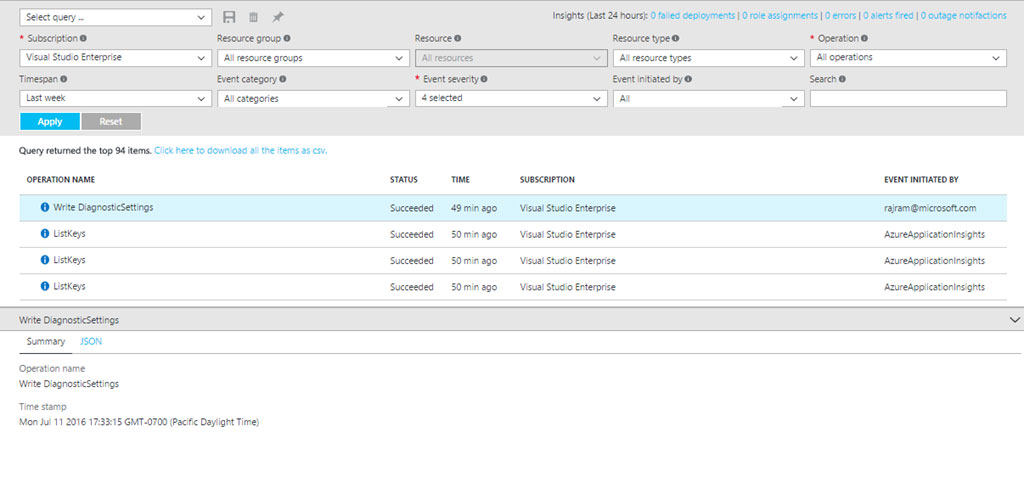 They have also improved the results interface. Caller info and service principle names show and the user can then click on the operation to see its summary.
In the future better alerts are coming, as well an improved metrics experience and an easy way to configure and view diagnostic logs.
The full changelog with detailed explanations can be found on the Azure blog.